The Costs of FAIR
I have written a bit about benefits of FAIR; however, a reader rightly pointed out to me that there is no such thing as a free lunch – what are some of the costs of FAIR?
Below is my first stab at a diagram that I hope distinguishes some costs and benefits of FAIR, and how they are related, in the case of building an “inside track” for an existing research-information lifecycle.
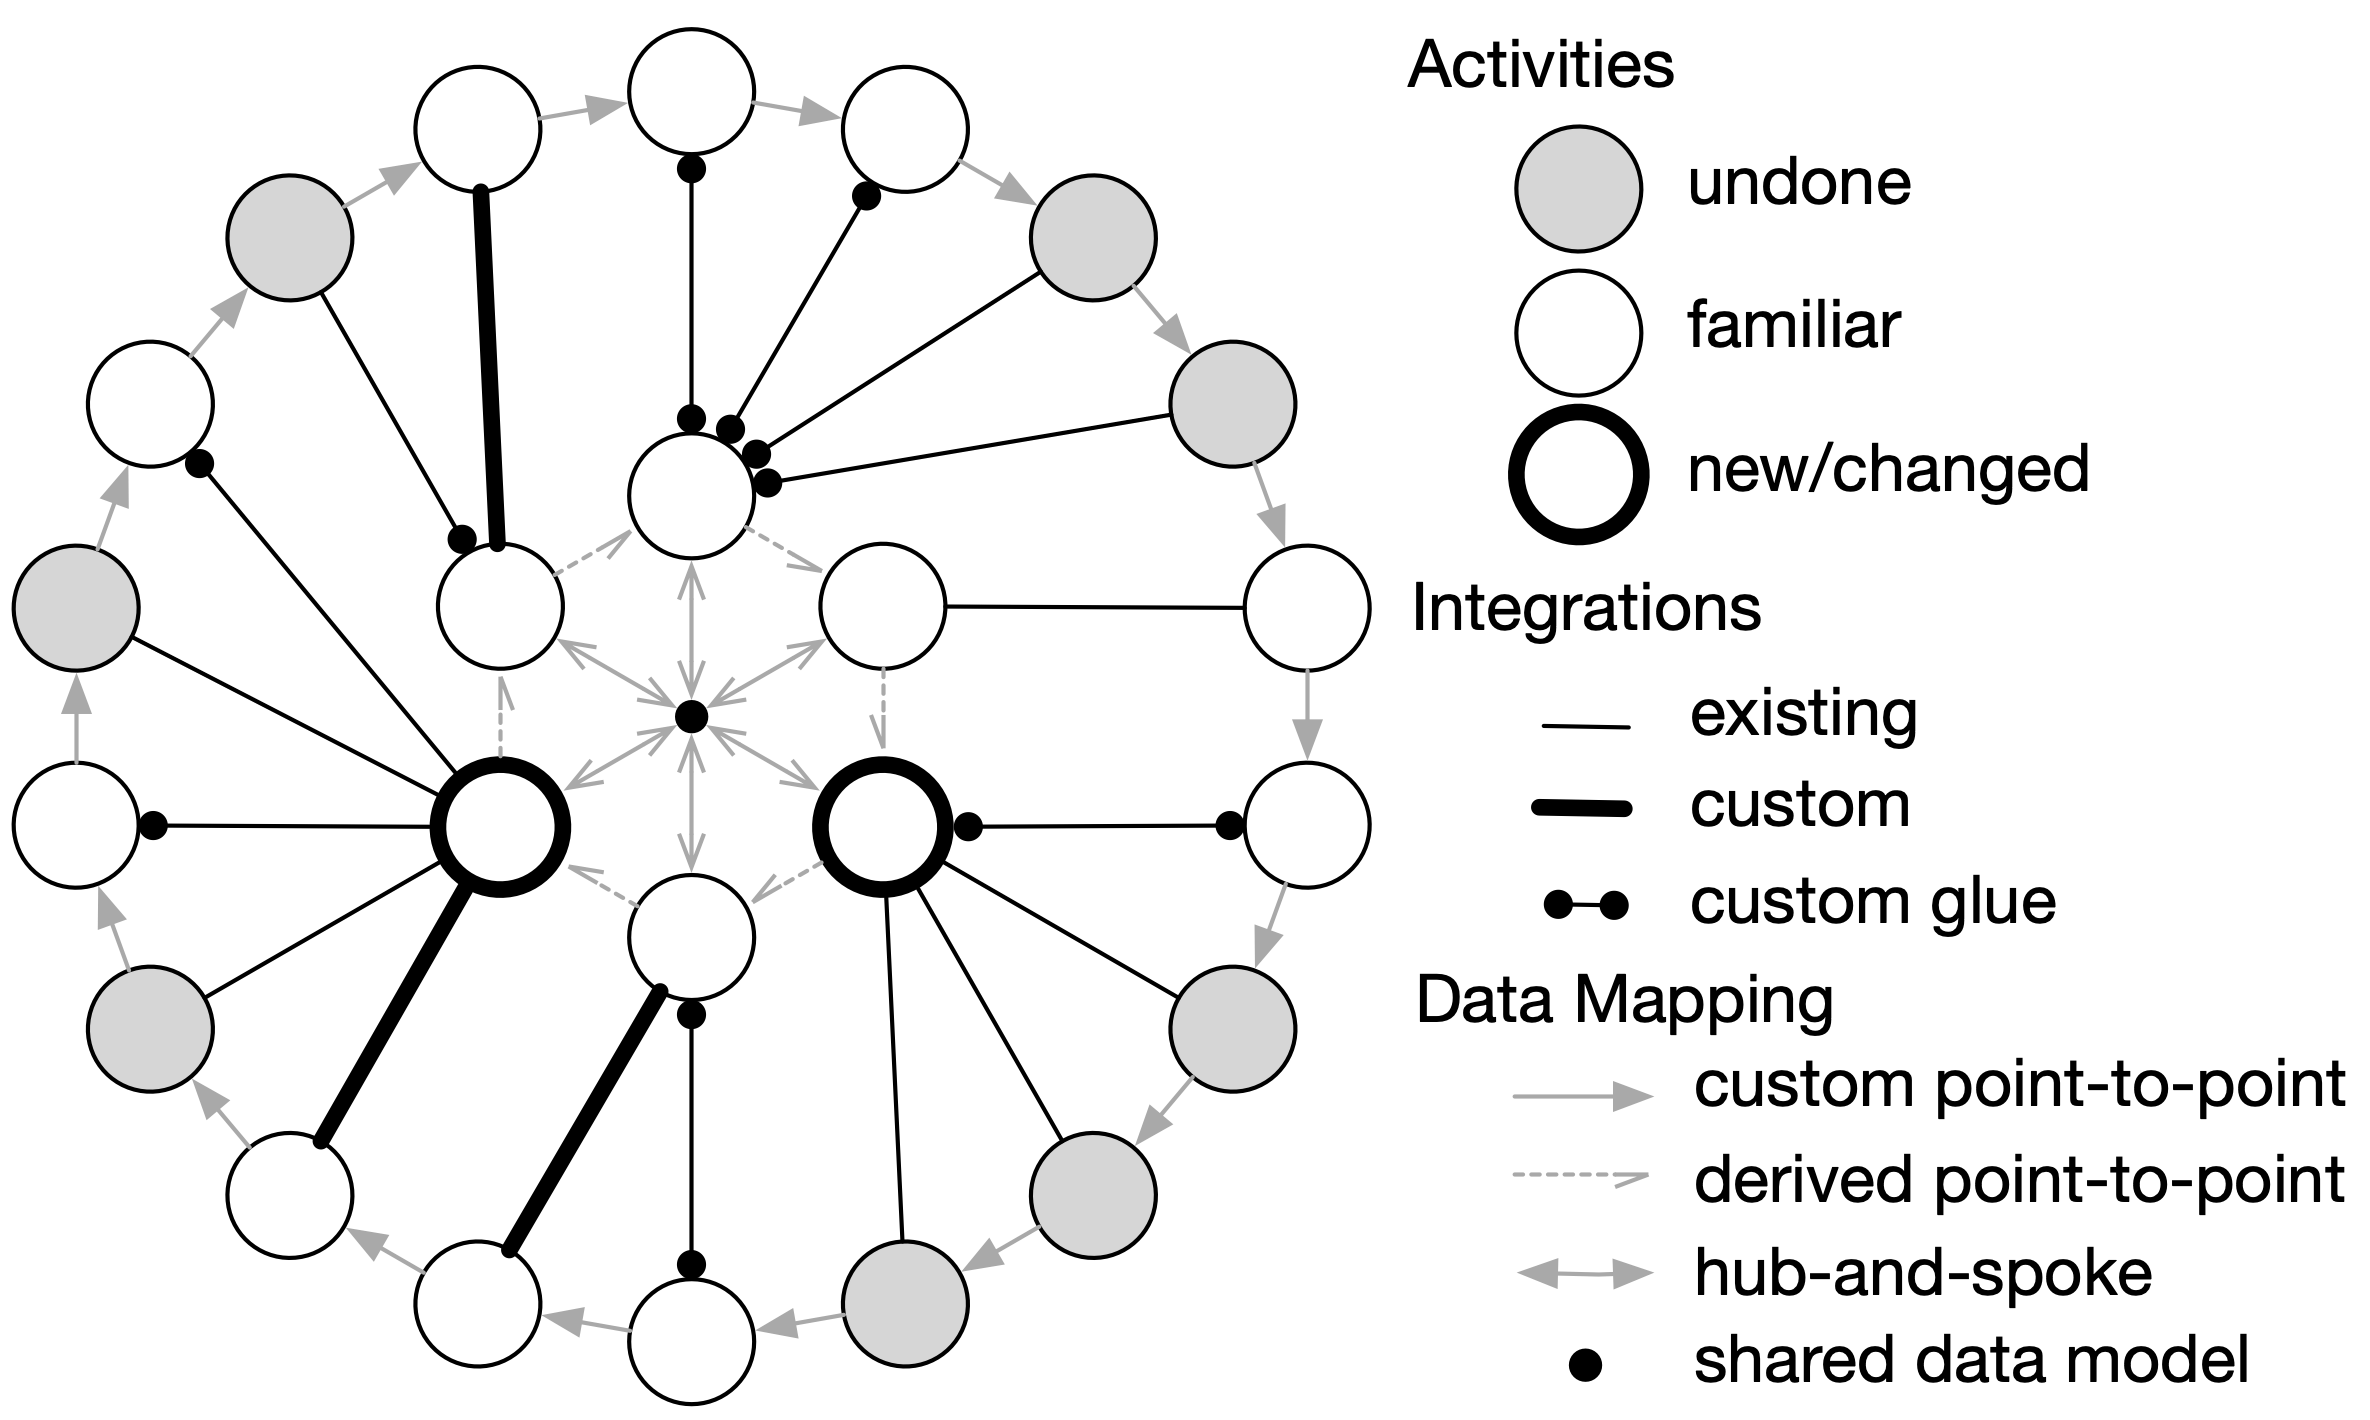
The outer rim represents an existing workflow of activities typical for a research project cycle in your lab. These activities include planning, gathering, producing, tagging, reviewing, analyzing, integrating, publishing, distributing, etc. The exact activities and their ordering doesn’t matter here. What matters is that there are a number of identified steps (18 in the diagram), and some are not actually done – either they are hard to consistently do well, or they are doable but are laborious and the cycle would take too long if they were included (so only 10 of the 18 in the diagram are actually done).
The inner rim represents a new workflow, one that uses FAIR infrastructure and that serves as a hub for outer-rim concerns. The benefits I hope the diagram conveys are the following:
Your new workflow has fewer (human-executed) activities. Instead of 10 steps, there are 6 steps.
Your new workflow does more. The 6 steps do what would have taken you 18 steps before.
Growth of data mappings among activities is linear because an activity need only map to a common data model.
I hope also that the diagram shows costs in various forms:
Some activities may need to change in order for them to “do more” behind the scenes (via automation). I represent this cost as thicker circles for activities.
Connecting what you’re doing to what machines are doing is also a cost: the cost of integration. Sometimes, integration is cheap because of existing standards/tools that are easy for you to use. Other times, you need to develop “glue” code to connect existing tooling to your special activity, shown in the diagram as a dot at either end of an integration edge. Finally, you may need to incur the cost of fully custom integration, shown in the diagram as thick integration edges.
If your workflow is a simple linear cycle, then your collection of data mappings among activities already grows only linearly; developing a shared data model, shown in the diagram as a central axle point, is a cost without clear benefit.
This post was a bit long, but I hope the diagram helps you consider the benefits of FAIR infrastructure in relation to its costs. I feel that many of the costs can be shared across a community with differing research workflows but common activity types. Let me know what you think.